Customer segmentation enables a business to group customers based on demographics (e.g., age, gender, education, occupation, marital status, and family size), geographics (e.g. country, time zone, language, and location), psychographics (e.g. lifestyle, values, personality, and attitudes), behaviour (e.g. purchase history, brand loyalty, and response to marketing activities), technographics (e.g. device type, browser type, and original source), and needs (e.g. product features, service needs, and delivery method). My challenge in this project is to apply critical thinking and machine learning concepts to design and implement clustering models to perform customer segmentation and improve marketing efforts.
- Project Definition
- Jupyter Notebook
- Report
🧩 Customer Segmentation for Global E-Commerce Optimization
📍 Project Summary
In this project, I performed advanced customer segmentation for a multinational e-commerce company, leveraging a real-world dataset of nearly 1 million transactions across 47 countries. The objective was to uncover distinct customer groups to support targeted marketing, loyalty strategies, and revenue optimization.
🌐 Dataset Overview
- Scope: 951,668 transaction records from 2012–2016
- Global Reach: Customers from 5 continents (Oceania, North America, Europe, Africa, Asia)
- Attributes: 20 features including demographic, behavioral, and financial metrics
🔍 Methodology
1. Data Preprocessing & Aggregation
- Cleaned and de-duplicated the dataset
- Aggregated transactional data to build a customer-centric view
- Handled missing values with consideration to analysis goals
2. Feature Engineering
Created high-impact features that align with customer value and behavior:
- Frequency: Purchase count per customer
- Recency: Days since last purchase
- Customer Lifetime Value (CLV): Total revenue per customer
- Average Unit Cost: Preference for low- or high-cost items
- Age: Derived from customer birthdate
3. Outlier Detection
- Applied Isolation Forest to detect behavioral extremes
- Flagged potential VIP customers and churn risks
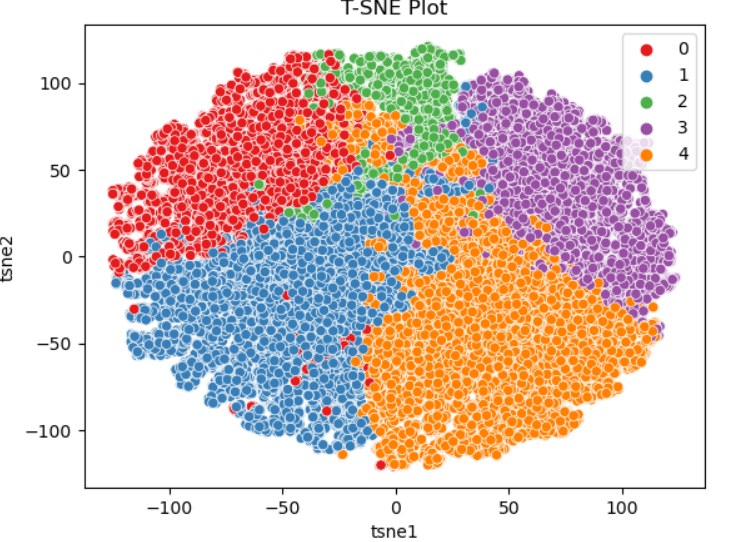
4. Dimensionality Reduction
- Used PCA and t-SNE for visualizing high-dimensional patterns
- Ensured clusters were interpretable and visually distinct
5. Clustering
- Determined optimal cluster count (k = 5) using:
- Elbow Method
- Silhouette Score
- Applied:
- K-Means for efficient segmentation
- Agglomerative Clustering with dendrogram validation
📊 Key Insights
- Identified 5 customer segments with distinct patterns in:
- Purchase frequency
- Lifetime value
- Product preferences
- Engagement recency
- Age demographics
- High-CLV clusters were isolated for loyalty program targeting
- Younger clusters showed high engagement—ideal for trend-based campaigns
- Outliers revealed high-risk or high-potential customer groups needing tailored strategies
🧠 Tools & Techniques
- Python, Pandas, NumPy, Scikit-learn
- Clustering: K-Means, Agglomerative Hierarchical Clustering
- Visualization: Matplotlib, Seaborn, Plotly
- Dimensionality Reduction: PCA, t-SNE
- Outlier Detection: Isolation Forest
🎯 Business Impact
- Enabled data-driven marketing segmentation across global markets
- Uncovered revenue-driving behaviors and underserved customer segments
- Empowered the organization to deliver personalized experiences, improving retention and conversion
- Built stakeholder confidence through clear reporting, visual storytelling, and actionable insights